

The new Flare release brings new and enhanced scientific features both for computational and medicinal chemists. These include significantly enhanced FEP calculations with the inclusion of Absolute FEP, Protein-protein docking, and Protein-Ligand Interaction Fingerprints (PLIF).
In this release we have also expanded and enhanced the already existing QSAR models with the inclusion of Gradient Boosting and the Distance to Model metric. Furthermore, the new Match 3D functionality superimposes proteins based on their secondary structure, and the new ‘PSA’ button calculates ligands’ Polar Surface Area.
Figure 1. Flare V10 offers a range of new functionalities for every computational or medicinal chemist
Accurately predict ligand binding affinities using Absolute FEP calculations
Absolute Binding Free Energy (ABFE) perturbation calculations provide a robust method for accurately predicting binding affinities. Unlike Relative Free Energy Perturbation (RFEP), which requires a congeneric series of molecules to compare, ABFE predicts the binding affinity of each molecule independently. This makes ABFE an invaluable tool for early-stage drug discovery, particularly during hit identification, where the ability to evaluate binding affinities across a range of compounds can provide critical insights into potential candidates for further development.
Flare’s Absolute FEP implementation leverages the SOMD1 engine for fast, GPU-accelerated calculations, while maintaining a user-friendly graphical user interface, ensuring easy to submit calculations.

Figure 2. The user-friendly interface of Flare lets you start the Absolute FEP experiment with the click of three buttons.
It also allows the seamless combination of Absolute and Relative FEP experiments within a single perturbation map. Such an application is particularly useful in cases where a ligand with a structurally distinct ligand is introduced. In these cases, an ABFE calculation can directly estimate the ΔG for the ligand in a single run, eliminating the challenges typically encountered with Relative FEP in scenarios involving significant structural differences.

Figure 3: Combined map of a finished Relative and Absolute FEP calculation in Flare.
Our method has been extensively tested in different scenarios and has demonstrated accuracy, robustness, and reliability across diverse molecular systems, making it a trusted approach for predicting binding affinities and molecular interactions.
Analyze and cluster ligands based on their interaction profiles with proteins using Protein-Ligand Interaction Fingerprints (PLIF)
Protein-Ligand Interaction Fingerprint (PLIF) is a computational method used to represent and analyze the interactions between a protein and a ligand. PLIF captures key molecular interactions, such as hydrogen bonds, hydrophobic contacts, salt bridges, and encodes them as a numerical fingerprint. Each element of the fingerprint corresponds to a specific type of interaction with a specific residue in the binding site.

Figure 4. Visualization of the fingerprints helps in the identification of the number of interactions per residue.
The implementation of PLIF in the new release of Flare uses clustering to enable rapid comparison of ligands based on their interaction profiles with target proteins. It also enables the identification of key interaction patterns associated with strong binding affinity, helping prioritize ligands that replicate these interactions for further optimization.

Figure 5. After a PLIF Clustering experiment, the PLIF fingerprint similarity is used to cluster the molecules, and the results are displayed in the PLIF Cluster View using a dendrogram.
Predict protein-protein interaction and binding with the new Protein-Protein Docking in Flare
Protein-Protein Docking is a computational technique used to predict how two proteins interact and bind to form a stable complex, focusing on identifying their most likely binding orientation and interaction interface based on their individual structures. It is applicable for predicting protein-protein complexes, protein dimers, protein-peptide complexes, and multimeric assemblies, with the latter achieved through iterative docking workflows.
In Flare, this process leverages the JabberDock algorithm,2 which employs Particle Swarm Optimization (PSO) to explore surface complementarity between binding partners. The method uses Spatial and Temporal Influence Density (STID) maps, derived from a protein’s dynamics trajectory, to capture its shape, electrostatics, and local dynamics for accurate docking predictions.
To run a Protein-Protein Docking experiment in Flare, the proteins of interest should be associated with a short dynamics trajectory. This trajectory will be used to calculate the STID maps. Typically, the larger biomolecule is designated as the ‘receptor’, while the smaller as the ‘ligand’. After the end of the experiment, the ‘receptor’ protein as well as the top scoring poses of the ‘ligand’ protein will be saved to the Protein table.

Figure 6. The Protein-Protein Docking experiment has managed to identify the correct binding mode for most of the solutions that are reported in the results.
Enhanced QSAR models with Gradient Boosting and Distance to Model metrics
Flare V10 expands and refines its QSAR capabilities with the introduction of Gradient Boosting functionality and the Distance to Model metric.
Gradient Boosting:
- Captures complex, non-linear relationships between molecular features and biological activity
- Provides high predictive accuracy while remaining robust to overfitting
- Handles diverse datasets effectively, making it ideal for optimizing lead compounds and predicting drug efficacy or toxicity with precision
- Uses hyperparameter optimization to improve model performance
- For datasets exceeding 1,500 molecules, Histogram Gradient Boosting is used, that improves computational efficiency by binning input features into integer-valued bins before training, enabling faster processing
Distance to Model:
- Evaluates the reliability of predictions by categorizing molecules as ‘Inside’, ‘Close’, or ‘Outside’ the descriptors space of the molecules in the training set
- Provides a clear assessment of how well a predicted molecule aligns with the training data, improving confidence in QSAR predictions
Together, these enhancements make QSAR modeling in Flare more versatile, accurate, and informative for decision-making in drug discovery.

Figure 7. Gradient Boosting is available both for Regression and Classification models. The Distance to Model metric, captured in the Ligands table, assesses whether the molecule of interest fits ‘Inside’, ‘Close’, or ‘Outside’ the descriptors space of the molecules in the training set.
Align proteins by matching their core secondary structural elements with Match3D
Traditional protein superposition methods rely heavily on sequence similarity, aligning proteins based on the similarity of their amino acid sequence. However, proteins that perform similar functions often share key 3D structural features, without necessarily maintaining high sequence similarity. Secondary structure-based superposition enables alignment of these regions, even when sequence similarity is low.
In Flare, the new protein secondary structure superposition, which is called Match3D, utilizes the Universal Structure (US) align algorithm,3 which optimizes the TM-score, a metric that evaluates structural similarity between two proteins independent of their sequence. Meanwhile, Flare’s existing ‘Superpose’ feature instead aligns proteins based on secondary structure similarity by matching their sequences and minimizing distances between corresponding residues, without considering the three-dimensional characteristics of the proteins.
The difference between the two methods is demonstrated in the example below, where two proteins (pdb codes: 1F51 and 1Y4T) that have similar structure, but low sequence similarity, are superposed. In such cases, the result from Superpose is a poorly aligned system, which is expected given the low sequence identity. Match3D addresses this issue by recalculating the optimal equivalent residues based on the three-dimensional similarity of the chains, producing a more accurate structural alignment.

Figure 8. Enhanced protein superposition is achieved with Match3D in cases where the sequence similarity of the proteins is low.
By focusing on secondary structure, Match3D provides a more robust and functionally relevant comparison of proteins, addressing the limitations of sequence-based methods.
Hidden gems of Flare V10
Whether you are a medicinal or a computational chemist, Flare V10 offers several additional tools that can significantly enhance your work. The new button for the calculation of the Polar Surface Area (PSA) and the Surface Area (SA) can give you insights into the absorption and permeability of the molecule of interest. In addition to this, it allows you to calculate the unscaled, size-dependent Electrostatic Complementarity™ (EC)4 score (Unscaled EC = EC * surface area). This alternative scoring provides insights that may be beneficial for analyzing ligands of varying sizes.

Figure 9. Calculate the Polar Surface Area (PSA) and Surface Area (SA) of the ligands of interest with the click of a button
Flare now offers a practical solution to the problem for those covalent docking experiments where you know the pose of a ‘template’ ligand, and wish to use this information to bias the docking results for congeneric compounds. With the new templating for covalent docking, the molecules to be docked are aligned by substructure to the template ligand, and the aligned conformation is used to seed the docking run, generally leading to improved docking results.

Figure 10. By selecting an optional template ligand to use to guide the covalent docking process, you get improved results.
Furthermore, Flare V10 introduces enhanced Quantum Mechanics (QM) capabilities, providing tools for precise molecular analysis. Torsion scans can be now performed within a specified dihedral range, with full control to define minimum and maximum angles. Structures can be minimized in solution using xTB,5 ensuring that geometries are optimized under realistic conditions while maintaining consistency between geometry optimizations and single-point calculations in solution. Finally, the ability to use carbanions as inputs for QM calculations broadens the scope of chemical systems that can be analyzed, delivering greater flexibility and accuracy in studying molecular conformations and energetics.
New and enhanced features for Spark™ in Flare
Several enhancements have been introduced to Spark in Flare, that streamline workflows and improve usability. You can now pre-select the R-group of the starter molecule you wish to replace by picking ligand atoms directly in Flare’s 3D window before launching the desired Spark wizard. This enhancement eliminates extra steps, saves time and allows for a more intuitive setup. A new advanced option allows you to set a time limit for docking each molecule, providing greater control over computational efficiency. Additionally, Spark results are now automatically tagged by experiment name for better organization and result tracking.
These enhancements facilitate the inclusion of bioisosteric replacement studies in Flare workflows and allow the user to work with greater accuracy, efficiency and confidence.

Figure 11. Left: Select the moiety of the molecule to be replaced in the Flare 3D window to skip one Spark wizard step – Right: Spark results are now automatically tagged by default with a name provided by the user.
New and enhanced features for Flare FEP
Flare FEP in V10 comes with several improvements, some of which are highlighted below:
If the Relative FEP graph of your project has clusters of molecules that are not well connected, you can improve the connectivity of the FEP graph, using the new ‘Enhance Connectivity’ button. Each click adds a new link, aiming to minimize the average shortest path length while prioritizing links with the highest scores. The algorithm selects the optimal link from the top 10% of distance-reducing options, with a strong bias toward the highest link score.

Figure 12. The addition of the new link with the click of a button enhances the connectivity between the two clusters in the FEP graph.
The new ‘Color links by quality’ will color the FEP graph based on a calculated quality score. The score considers the quality of the convergence plots, the overlap matrix, and the contacts. The color scheme is intuitive: red indicates poor quality, gray signifies average quality, and green represents good quality.

Figure 13. Quickly and visually identify problematic links in the FEP graph.
In the enhanced Activity plot, if the ‘Precision’ checkbox is ticked, you can view the confusion matrix with the number of True Positive (TP), True Negative (TN), False Positive (FP) and False Negative (FN) predictions of the ligands under study. The settings of the FEP map have also been moved to a new widget that allows you to modify the axis range and units, as well as to change the background colour of the plot.
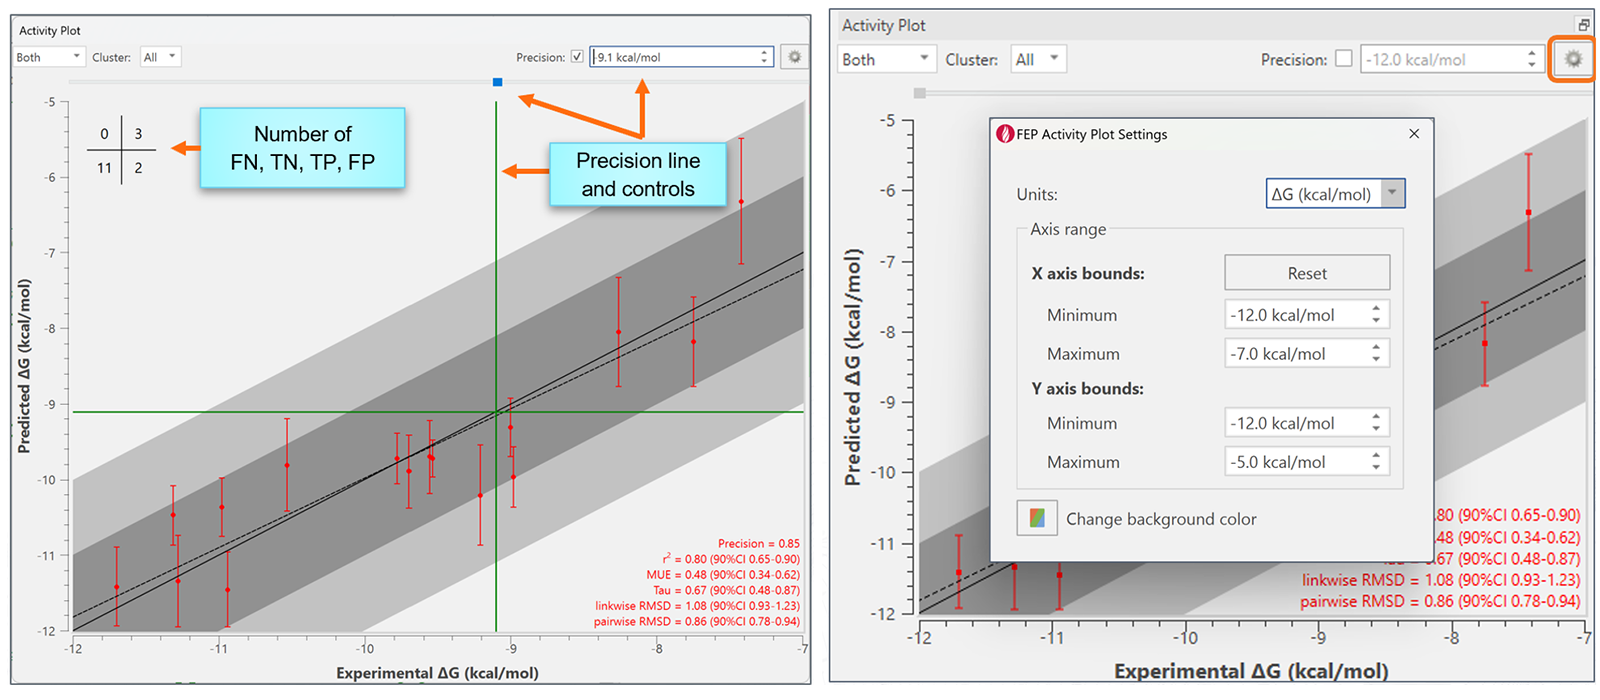
Figure 14. Left: Number of FN, TN, TP, FP shown at the graph. Right: the Settings of the Activity plot are now grouped in a single widget.
Other enhancements in Flare FEP include the ability to highlight atoms forming a contact in the 3D view by clicking a row in the Contacts table; the addition of box information to the FEP project log; new pairwise (per-compound) RMSE statistics; and improved flexibility when restarting or continuing an FEP calculation, allowing changes to the equilibration stage settings and the option to toggle GCNCMC on or off.
New and enhanced features for molecular dynamics simulations
Dynamics in Flare V10 comes with several additions and enhancements for molecular dynamics simulations. Some of them are detailed below:
The new feature to constrain angles and torsions during the Dynamics calculation, together with distance and positional constraints , allows you to simulate dynamics with a restrained protein backbone. The widgets for setting distance and position constraints have also been updated for improved user-friendliness. All the restraint information is also added to the atom tooltip.

Figure 15. New and enhanced widgets for the constraint of positions, distances, angles and torsions during a Dynamics simulation
A few enhancements have been made to functionalities relating to trajectories. For example, you can now export trajectories without the inclusion of solvent, and you can resume a molecular dynamics simulation from an imported pdb structure and a trajectory file. If you wish to select a specific frame from a trajectory and save it, the frame duplication feature now automatically appends the original frame’s information to the newly created protein. This ensures that the origin of the selected frame is linked to its source, making it easier to track and manage protein conformations coming from different parts of the Dynamics trajectory.

Figure 16. The frame number is automatically added to the duplicated protein
Other enhancements, such as the addition of improved AMBER 5-phosphate parameters in openmmff, the ability to export calculations with a custom equilibration protocol, new buttons to easily switch between plots and the identification of the frames belonging to a certain PCA cluster include some more examples of the wealth of features that have been added to Dynamics in Flare V10.
A variety of enhancements and improvements
With each Flare release, we dedicate significant effort to not only incorporate exciting new scientific advancements but also to enhance usability, often based on direct feedback from our users. Below are some of the other notable new features that are coming up in Flare V10:
- Get significantly enhanced results if you are working with macrocycles or large structures, with the new enhanced Maximum Common Substructure (MCS) ligand-based alignment algorithm
- Use the new ‘HELM’ Flare extension to create new peptides using HELM notation and add new monomers/building blocks to the list of non-natural residues supported by HELM
- Control the ribbon transparency of the proteins shown in the 3D window
- Create an Annotation Marker sphere to map regions of empty space in the 3D window. The sphere has customizable size and color, and an optional associated label
- Enhanced connection to the Cresset Engine Broker: when a calculation is enabled on multiple brokers, it will automatically start on any broker that has available capacity at the time.
- Enhanced protein preparation and structure check for DNA and RNA
- Enhanced Loop Modeling with FREAD,6 now cloning ligands, waters and cofactors into the fixed protein when working in automatic mode
Allow Flare to guide you through the drug design process
Flare V10 delivers cutting-edge scientific methods, advanced analysis tools, and intuitive usability enhancements, providing deep insights into your ligand-protein complexes.
Try out Flare’s rich and user-friendly interface and discover how it helps you to drive lead optimization with confidence.
Contact us today to arrange an evaluation and quickly gain access to Flare’s extensive features. Our dedicated team is ready to support you through installation and setup, while our comprehensive library of tutorials – covering everything from common workflows to advanced methods and functionality will help you get started.