

In this blog I will show the value of using 3D-RISM1 a Flare water analysis tool, to analyze a macrocycle inhibitor bound to the active site of human MBP-Myeloid cell leukemia 1 (MCL1). MCL1 is an important anticancer target, which a recent paper by Rauh et al.2 describes for discovery of a potent and selective inhibitor, BRD-810 inducing tumor cell death.2 This publication includes a crystal structure with the BRD-810 macrocycle in complex with the target. I will analyze the structure and use 3D-RISM to understand the binding of the macrocycle and use this to aid the design of new compounds and cover how the water analysis can be used to aid set up for additional calculations.
Binding site exploration
Firstly, I downloaded the 8T6F PDB2 structure together with the electron density maps. I started by examining the fitted electron density map (Figure 1, purple mesh, 2fo-fc map) and then displaying the difference map (fo-fc map) to look for overfitting or unaccounted atoms of the model. I also looked at the observed alternative amino acid side chain positions, considering the observed occupancy and looked at crystal contacts for any artifacts from the crystal packing.

Figure 1. PDB 8T6F2 visualised in Flare showing the electron density map (2fo-fc map) of BRD-810 macrocycle bound to the BH3 groove of MCL1. I focused on examining ligand and active site residues plus waters position to the fitted electron density to have confidence in the protein structure. The binding site is partly water exposed, in particular three waters (labelled 1-3) are near the macrocycle.
Focusing on three waters (Figure 1) given their proximity to the binding site, all have electron density at 1.5 sigma and could potentially be making important interactions. After examining the electron density, I used ‘Protein Preparation’ and ‘Protein structure Checker’, two integrated tools within Flare, designed to optimise and validate protein structures. The former was used to keep all waters, add protons and minimize, followed by the latter to check clashes, invalid valences and capped termini. The ligand protonation and tautomer states were checked, then a Molecular Dynamics (MD) run for 10ns with GCNCMC and 150mM NaCl was run. The MD was run to relieve any stress in the protein-ligand structure from forming protein crystals.

Figure 2. A snapshot taken from an MD run on prepared PDB 8T6F2 showing the hydrophobic surface of the binding site (yellow denotes hydrophobicity and blue hydrophilicity) and the original crystal waters (highlighted in pink) superimposed onto the dynamics frame. The three waters of interest are in ‘capped’ render (near the binding site) versus the other X-ray water predictions in ‘line’ render.
Figure 2 displays the hydrophobic surface of the protein to help understand the binding environment and compare the original crystallographic waters (highlighted in pink). We examine here the thermodynamics of these three waters close to the macrocycle lying on the hydrophilic surface (blue surface). There are no other waters from the crystal in the active site, which is largely hydrophobic (yellow surface) and occupied with the inhibitor. The binding groove has a deep hydrophobic pocket that the bicyclic rings of the macrocycle extend into, while the carboxyl and morpholine substitutions of the macrocycle protrude into the water-accessible region on the protein surface (blue surface, left and right-hand side respectively). This area is on the surface and accessible to bulk water.
Binding site hydration (preparation)
To get a deeper insight and more accurately model the hydration of the binding site, the 3D-RISM (Three-Dimensional Reference Interaction Site Model) method was used. 3D-RISM is a computational method used to predict the distribution and occupancy of solvent molecules, around a biomolecular structure by calculating particle density grids based on molecular interactions. I ran a holo 3D-RISM calculation, making use of the Cresset XED forcefield3 for excellent electrostatics modeling (Figure 3), and compared the MD snapshot and original crystal water site positions. This is run using the context of the protein and ligand (see 3D-RISM panel in Figure 3), and with no ‘knowledge’ of the crystal waters. The output of a 3D-RISM model gives a grid containing particle densities (O and H densities for water) which allows you to predict water occupancy (surface) and sites (spheres ‘3DR’). We focused here on three waters of interest but note that 3D-RISM can provide oxygen sites (3DR) that can be easily converted into water for hydration of your whole target, and so prepared as input for further modelling. This process of running MD to check the stability and binding your system and then a holo 3D-RISM to hydrate accurately your system is recommended when your model will be used in quantitative binding affinity simulations further along your drug discovery workflow such as MM/GBSA and FEP. BRD-810 has a known measured affinity along with several substituted macrocycle indole derivatives4, making this a good candidate target for benchmark FEP followed by production FEP, to test new design ideas.

Figure 3. Calculating a holo 3D-RISM (tab circled in orange) water analysis in Flare: selecting the ligand and protein chain to include the context of the protein-ligand complex and using the XED3 forcefield. Results appear in the Surfaces section and then you can right click on selected water molecules (here in blue: water 2 from the crystal structure) to compute expected 3D-RISM ∆G contributions in kcal/mol.
Figure 3 shows that we can calculate individual water ∆G contributions with 3D-RISM for each original crystal water site: giving you values in kcal/mol and colouring (green denotes ‘happy’ and red ‘unhappy’ waters), or favorable/ unfavorable binding energy contributions respectively. The results are displayed in Figure 4 where I compare on the left: the original crystal water positions (protons not shown since they cannot be resolved) and on the right: the interactions of waters seen in our MD snapshot. Examining the 3D-RISM values for waters 1-3 gives: -0.8, -1.6 and -1.5 kcal/mol versus -0.4, -2.0 and 0.3 kcal/mol. The RMSD of the 2 water sites (crystal on the left and MD snapshot on the right) are: water 1 = 1.1Å, water 2 = 0.7Å and water 3 = 0.2Å, indicating good agreement of the oxygen positioning between the crystal and MD models. Using 3D-RISM with no knowledge of these three crystal waters (right side of Figure 4) accurately predicts their positions (left side of Figure 4).
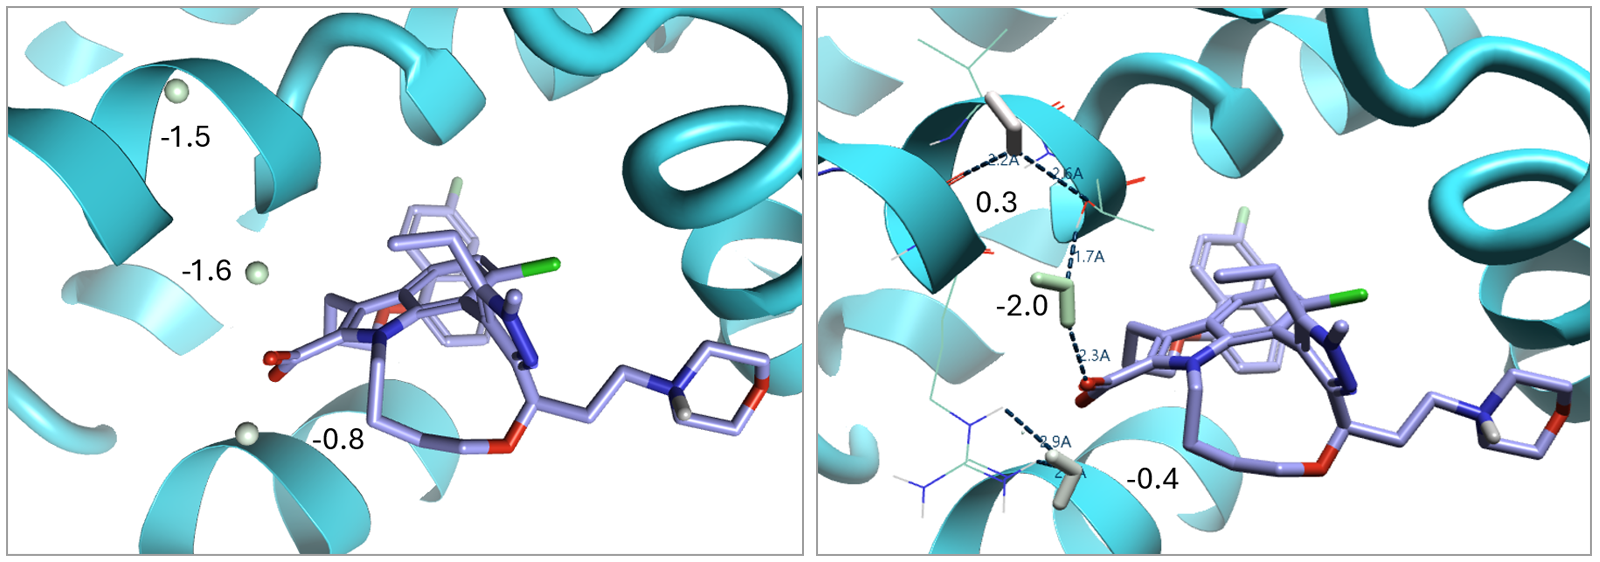
Figure 4. Comparing left: the original crystal water sites (protons not shown, as they cannot be resolved) and right: the selected MD snapshot water sites, both colored by the computed 3D-RISM ∆G and showing the values in kcal/mol. Individual ∆G contributions of the three waters of interest are left: -0.8, -1.6, -1.5 and right: -0.4, -2.0 and 0.3 kcal/mol. The waters are colored by green denoting ‘happy’ or red ‘unhappy’ waters. The RMSD between the 2 displayed water positions (the oxygen sites on the left vs right) are 1.1Å, 0.7Å and 0.2Å for waters 1-3 respectively.
We see from MD analysis (Figure 4, right) that frequent water interactions occur:
- Between solvent accessible water 1 hydrating the ARG 263 and carboxyl of the macrocycle.
- In 96% frames bridging water 2 donates a H-bond to the carboxyl of the macrocycle and accepts a H-bond from THR 266, exhibiting a ‘DA’ pattern.
Water 3 donates a H-bond to the THR 266 and the backbone oxygen of GLY 262, exhibiting a ‘DD’ pattern and stabilizing the protein. It is reassuring to see agreement between the crystal input and MD trajectory. Water 1 is happily hydrating the salt-bridge interaction between the ARG 263 and carboxylate of the macrocycle whilst also interacting with surrounding waters and open to exchange with bulk. Water 2 is the most ‘happy’ water and this aligns with the expectation that water 2 is a bridging water contributing to the interactions of the macrocycle with the target. This is as frequent occurrence, or strong interaction, shown in the MD trajectory (96%), which confers with its ∆G kcal/mol prediction in the original water site from the crystal. We establish that this water should certainly be included in further models, particularly those that quantify energetics at the binding site. In fact, we can reliably use 3D-RISM to hydrate the binding site (Figure 5) and whole protein site, identifying the important waters. 3D-RISM is an accurate method that can validate the crystal waters present4 and hydrate the whole system appropriately. Finally, water 3 is potentially stabilizing the structure making frequent DD interactions donating two H-bonds to amino acids on the backbone, but it is also on the hydrophilic surface exchanging with bulk water, which essentially water prefers (the bulk).

Figure 5. Showing left: original crystal water positions (red and white, ‘capped’) and right: their agreement with our model after preparation, dynamics, 3D-RISM calculation (with no ‘knowledge’ of experimental waters). All waters (but we visualise just our three waters, highlighted pink, under investigation for clarity) have been taken from 3D-RISM predicted ‘3DR’ oxygen densities and edited and prepped to show realistic water interactions. Showing also the surface of oxygen density from the 3D-RISM calculation in mesh and coloured green for ‘happy’ and red for ‘unhappy’, the three waters lie on this surface as expected, and the whole surface demonstrates that we can get solvation predictions of the whole system.
Figure 5 shows the oxygen density surface (mesh) from 3D-RISM, colored green for ‘happy’ and red for ‘unhappy’. Not only does the 3D-RISM calculation identify the same locations as observed in the crystal structure5, 3D-RISM typically analyzes the whole system and can suggest locations for simulations that were not observed in the crystal structures. This can be crucial for use in advanced SBD simulations and invaluable where there is no or incomplete experimental data (e.g. homology, AlphaFold models, cryo-EM). Water molecules play essential roles in protein binding sites, and 3D-RISM can economically and quickly (~20 mins on 1 CPU) allow you to accurately include them in your drug discovery.
Driving drug design
Flare can facilitate drug design using a combination of surfaces and 3D-RISM. By examining the hydrophobic surface and selecting the ‘3DR’: 3D-RISM oxygen sites (spheres, coloured green for ‘happy’ red for ‘unhappy’) that are < -1.5 and > 1.5 kcal/mol, we can investigate the binding region and look for places to add functional groups that might replace a ‘happy’ water, or in this case displace an ‘unhappy’ water (Figure 6). In this way we can search for new drug design ideas, optimising on BRD-810 by adding simple modifications, potentially in this case to increase binding potency which could then be tested in silico using a computationally robust method.
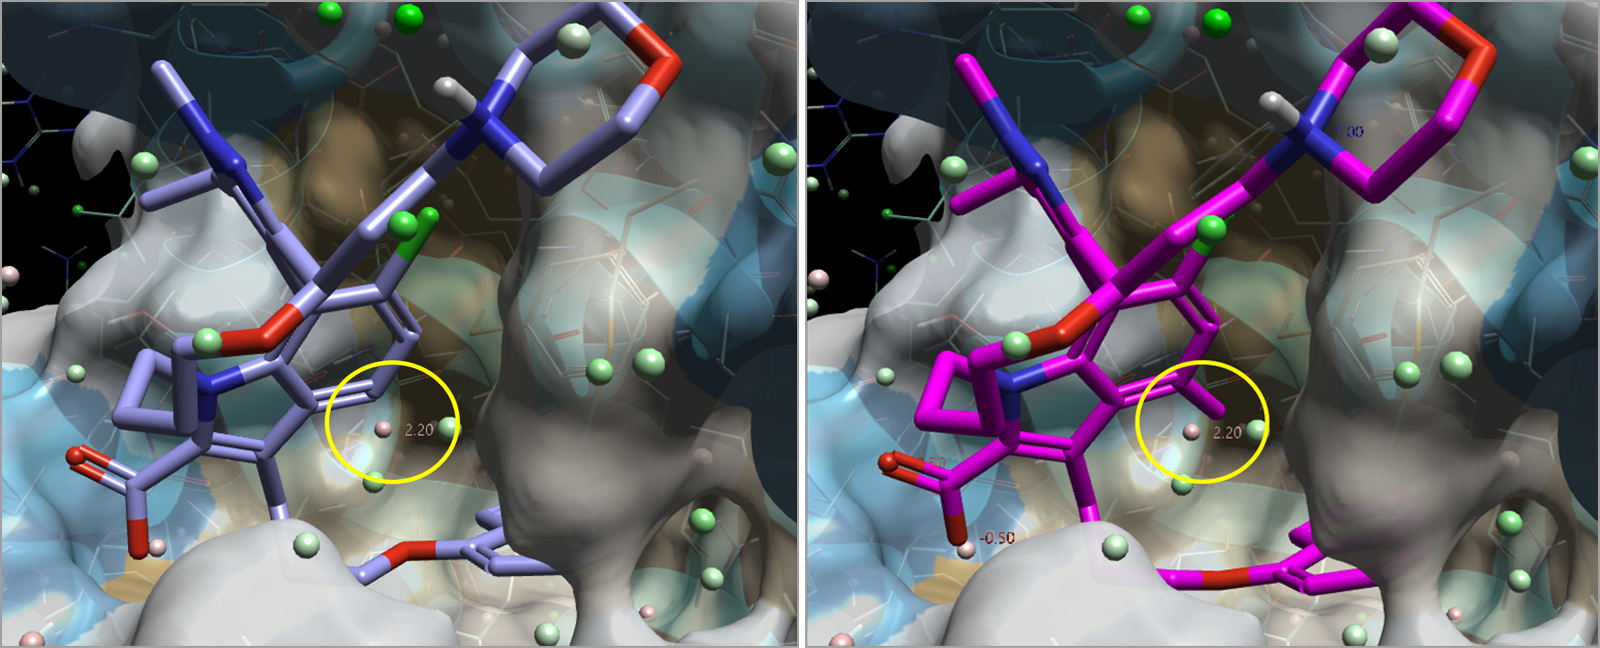
Figure 6. Using the hydrophobic surface and selecting the ‘3DR’: 3D-RISM oxygen sites (spheres, coloured green for ‘happy’ red for ‘unhappy’) that are < -1.5 and > 1.5 kcal/mol. For example, here a 3DR shown with ∆G 2.20 kcal/mol (circled, yellow) is ‘unhappy’, or has unfavorable binding free energy contributions, and sits within the hydrophobic region, adding a methyl group (right: ligand in pink) here to ‘displace’ the ‘unhappy’ water could increase binding affinity.
For example (Figure 6) based on this 3D-RISM analysis in Flare we might suggest investigating derivatives of BRD-810 with simple but judicious placements of a hydrophobic group in the hydrophobic region that removes the ‘unhappy’ water. Displacing this water could potentially increase potency by ~ 2kcal/mol, in this example. Therefore, water analysis with 3D-RISM can help inform design ideas such as adding a methyl group (pink ligand in Figure 6) or a larger halogen such as Cl as a substituent to displace the ‘unhappy’ water and increase potency.
Similarly, if there is an opportunity to replace a ‘happy’ e.g., by placing a polar functional group in a more hydrophilic region that replaces interactions of the water with the protein and releasing the water to bulk, then this could also increase potency.
Note that this is not a definitive demonstration of the capabilities and use of 3D-RISM.Here the focus was on analyzing bound ligand structures, to ensure correct hydration of a system for advanced calculations, as well as informing new designs of compounds to displace or replace water molecules.
3D-RISM calculations can also be performed on the apo (non-liganded) structure. These calculations help you understand why a ligand binds from a water displacement view, and also access the putative binding sites when they are not known (examine the druggability of a pocket). This could be particularly useful for growing fragments or creating macrocycles from non-cyclic compounds for example. Examining the water occupancy mapped out by an oxygen surface can guide the shapes and structures of compound designs to indicate where and what you want to grow. If your new compound ideas are difficult and/or costly to produce, examining the water occupancy with 3D-RISM can give you confidence in making the right designs. Ligand binding is dominated by the cost or benefit to desolvate the active site and 3D-RISM can allow you to quickly, economically and accurately explore and exploit these desolvation effects in drug design.
References
- T. Luchko, et al. Three-dimensional molecular theory of solvation coupled with molecular dynamics in Amber. J. Chem. Theory Comput. 2010, 6, 3, 607–624. https://doi.org/10.1021/ct900460m
- U. Rauh, et al. BRD-810 is a highly selective MCL1 inhibitor with optimized in vivo clearance and robust efficacy in solid and hematological tumor models. Nat Cancer. 2024. https://doi.org/10.1038/s43018-024-00814-0
- J. G. Vinter. Extended electron distributions applied to the molecular mechanics of some intermolecular interactions. J Computer-Aided Mol Des 8, 653–668 1994. https://doi.org/10.1007/BF00124013
- US11891404B2 – Substituted macrocyclic indole derivatives – Google Patents
- L. Fusani, et al. Optimal water networks in protein cavities with Gasol and 3D-RISM. Bioinformatics. 2018 Jun 1;34(11):1947-1948. https://doi.org/10.1093/bioinformatics/bty024